
The most useful ecommerce personalization metrics connect three things: what the visitor is trying to do, whether the experience helps them do it, and whether that progress creates business value.
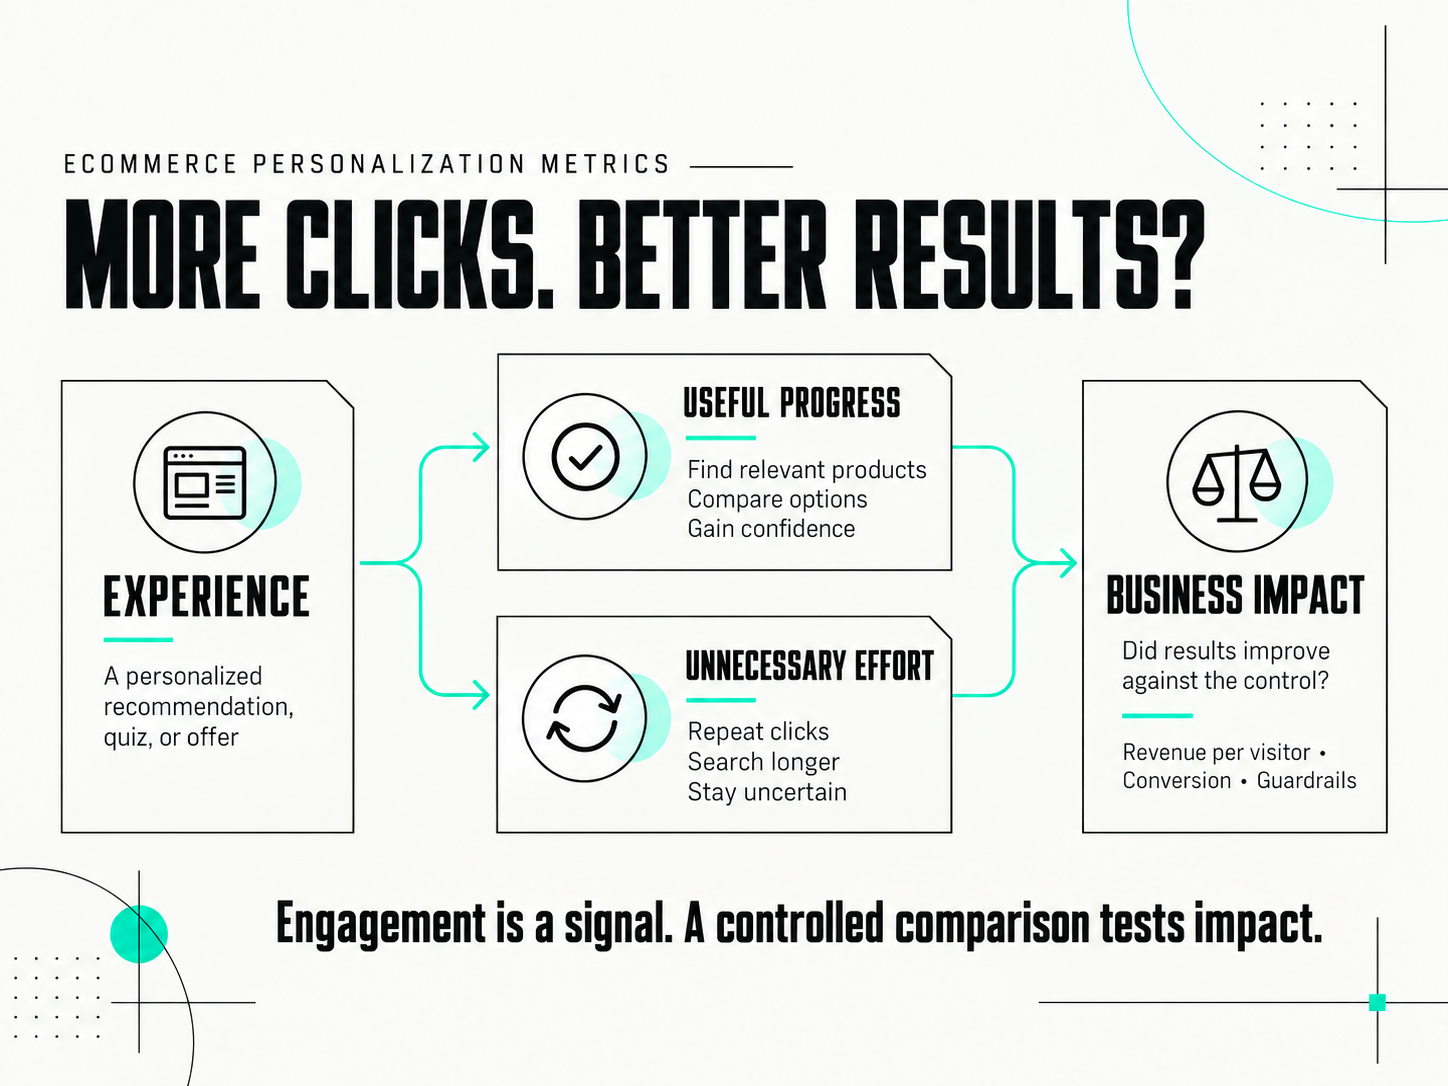
Start with a clear outcome, compare the personalized experience against a control, and use behavioral metrics to explain the result. More clicks alone do not prove personalization worked. Neither does a higher conversion rate if the revenue or margin tradeoff makes the business worse off.
Here is how I approach measurement, from choosing personalization KPIs to deciding what deserves another test.
Which ecommerce personalization metrics should you track?
I organize measurement into three groups: business outcomes, behavioral diagnostics, and guardrails. Each answers a different question.
| Metric group | Examples | What it tells you |
|---|---|---|
| Business outcomes | Revenue per visitor, purchase conversion rate, average order value, profit per visitor where reliable | Whether the experience changes commercial performance |
| Behavioral diagnostics | Product exploration, useful filter interactions, recommendation clicks, add-to-cart rate, checkout progression | How visitors respond and where the journey changes |
| Guardrails | Errors, loading performance, abandonment, margin, cancellations or returns when measurable | Whether an apparent improvement creates an unacceptable tradeoff |
Choose a primary metric before the experience launches. Add a small set of diagnostics and guardrails that fit the hypothesis. A dashboard full of metrics makes it easy to find something positive after the fact.
For a revenue-focused ecommerce experience, revenue per visitor is usually my starting point. For an early discovery experiment, a closer measure of useful progression may be the primary learning metric, while revenue remains an important business check. An engagement result and a demonstrated revenue result are different claims.
Optimizely’s guide to primary, secondary, and monitoring metrics explains the tradeoff: events closer to the change can be easier to detect, while downstream outcomes keep the work connected to business performance.
Why conversion rate alone can mislead
Conversion rate tells you how often a defined conversion happens within a defined population and window. It does not tell you the value of those purchases or explain what helped visitors decide.
A personalized promotion might increase orders while encouraging visitors to buy cheaper products. A comparison tool might help visitors choose a more suitable product without increasing the percentage who purchase. You need more than one number to understand either result.
Revenue per visitor is revenue divided by visitors over the measurement window. Conversion rate and average order value help explain changes in that revenue. Keep definitions consistent: revenue per session and revenue per unique visitor are different measures.
RPV also has limits. It does not measure profit, satisfaction, or future purchases outside the window. A revenue increase driven by heavy discounting still needs a margin check.
My revenue per visitor versus conversion rate guide goes deeper into that comparison. Here, the point is to use the measures together rather than letting one hide the tradeoffs.
Match behavioral metrics to the visitor’s task
Visitors exploring an unfamiliar category need different help from visitors choosing a size or completing checkout. Your diagnostic metrics should reflect the problem the experience is intended to solve.
| Visitor task | Useful diagnostics | Interpretation to check |
|---|---|---|
| Find relevant products | Relevant product exploration, narrowing behavior, product-page progression | Are visitors finding suitable options, or clicking around because the choices remain unclear? |
| Compare and choose | Comparison use, option selection, add-to-cart behavior, customer feedback | Does the experience resolve uncertainty, or add another decision? |
| Complete a purchase | Checkout progression, payment errors, purchase conversion | Are visitors completing the journey without a damaging revenue or margin tradeoff? |
| Return to continue shopping | Return visits, re-engagement with saved preferences, purchases within a defined follow-up window | Does the experience help across visits, compared with a consistently assigned control? |
Do not treat a longer session as automatically better. It can mean interest, confusion, or both. The same applies to scroll depth, filter usage, and repeat visits.
Intent is useful context, but it is not a shortcut to knowing someone’s goal. Use behavior and customer evidence to support the interpretation. A returning visitor is not automatically ready to buy.
If the pattern suggests people are struggling, use the approach in my guide to identifying and prioritizing ecommerce friction to investigate before choosing the next change.
How to measure personalization lift
A personalized audience often performs differently from average site traffic before you change anything. Comparing those two groups can make targeting look like impact.
Where feasible, randomly assign eligible visitors to the personalized experience or a control. The control should represent the experience those same eligible visitors would otherwise receive.
- Define the hypothesis. State the visitor problem, the proposed change, and the outcome you expect to improve.
- Define eligibility before treatment. Specify which visitors qualify using information available before the personalized experience can influence their behavior.
- Keep assignment consistent. For a journey that spans visits, keep visitors in the same group where your identification and testing setup allow it.
- Set the measurement plan. Agree on the primary metric, diagnostics, guardrails, follow-up window, and sample requirements before launch.
- Check the experiment. Confirm the experience renders correctly, events are collected consistently, and the allocation matches the intended split.
- Read the result with its uncertainty. Consider the effect size and confidence interval, not just whether a dashboard labels the result a winner.
Microsoft’s research on trustworthy experiment design covers why the hypothesis and randomization choices matter before a test begins.
Calculate relative lift as (variant metric − control metric) ÷ control metric × 100. Report the underlying values too. For example, a hypothetical conversion increase from 2% to 2.2% is a 10% relative lift and a 0.2 percentage-point increase.
A positive estimate with a wide interval is still uncertain. An inconclusive result does not prove there is no effect. It may mean the test cannot distinguish a meaningful change from noise with the evidence available.
Do not compare clickers with everyone else
Visitors who click a recommendation, finish a quiz, or open an offers drawer have selected themselves through their behavior. They may already be more motivated than visitors who do not interact.
Use that analysis to understand behavior. Use the randomized comparison to assess the effect of offering the experience. Otherwise, you risk giving the feature credit for motivation the visitor brought with them.
Case study: measuring beyond the initial quiz
We launched an engagement ring style quiz to help visitors identify their preferred style. Many visitors completed it, but the initial quiz experience did not immediately lift conversion.
We then used those preferences to personalize future visits:
- The homepage hero reflected the visitor’s selected style, with a route into that collection.
- Product recommendations featured popular rings in the selected style.
In the follow-up personalized experience, conversion rates increased by 11% across all styles and by over 40% for some style collections.
The initial engagement gave us a useful signal to test further. The later experience produced the conversion result. Keeping those stages separate matters: quiz completions alone did not establish commercial value.
For similar work, decide how you will connect visits and evaluate the follow-up experience before calling the whole journey a win. Returning quiz participants should not simply be compared with unrelated site traffic.
Read segment results without chasing winners
An experience can help the overall audience while creating a worse experience for a particular group. My promotion-drawer case study illustrates that distinction: broad ecommerce results improved, while the deal-seeking audience responded differently.
Define the most important segments before launch, such as device, entry channel, or an existing customer attribute. Where intent is the targeting signal, use its value before treatment to make a fair comparison.
Check the size and uncertainty of each segment result. A positive number from a small subgroup is a reason to investigate, not automatically a reason to roll out targeting. If you discover a promising segment after the test, treat it as a hypothesis for a follow-up experiment.
What a useful personalization report should include
A report should help someone make the next decision. Include:
- The question: Which visitor problem did the experience address?
- The comparison: Who was eligible, what did the control see, and how were visitors assigned?
- The business result: Primary metric, underlying values, effect size, uncertainty, and relevant tradeoffs.
- The behavioral explanation: What changed in the journey, supported by diagnostics and customer evidence?
- The limits: Measurement window, identification gaps, small segments, or incomplete downstream data.
- The decision: Roll out, refine, retest, stop, or investigate further, with a reason.
The question is not whether you can find a metric that went up. It is whether the evidence supports the decision you are about to make.
Have results, but no clear next move?
If your team has personalization results, experiment reports, analytics, or customer research but is struggling to decide what deserves attention, my Ecommerce Growth Opportunity Sprint brings that evidence together.
You receive 5–10 prioritized opportunities and a strategy readout explaining the customer problem, the evidence, and the recommended next action. That may include measurement gaps to resolve before another experience goes live.
The fixed investment is $4,500, with a typical turnaround of 7–10 business days once access and materials are available.